One of the most ubiquitous and discussed icons of a human food controversial era remains in force in several countries, despite recommendations in the opposite direction
She has worked hard enough. The world has completely changed in these 26 years, and colleagues feel that she no longer understands what is going on. The boss has already declared her retired and asked her to go home, but there is no way to make her understand she must obey.
In an image era, the food pyramid continues to enrapture likers, followers and shares. She was born in a world where few people knew that Donald Trump existed, that the fortunes of Bill Gates and Steve Jobs were much smaller, and where hunger scared more than obesity.
If she does not care at all for politics, much less for bytes and smartphones, nevertheless the pyramid has something to tell us about obesity. She has become the symbol of a food paradigm that splits everything by nutrients. The icon of an idea that demanded people to become experts in their own food, but it failed.
If you are under twenty, you possibly faced the pyramid at school. She continues present in several didactic and secondary materials.
Never straightens herself up
The pyramid was born in 1992, the result of a long and troubled gestation. Since mid-century, and more strongly after the 1970s, we had the carbohydrates era. Fats were demonized, and sugar and flour, ubiquitous, looked good.
The United States Department of Agriculture (USDA) began publishing dietary guidelines every five years. Note that the initiative did not start from a health agency, but from the address of the ruralists. In the late 1980s, the USDA decided to create a symbol that summarized the official guidelines. The pyramid was chosen from hundreds of designs because it represented better results in communicating moderation and proportionality. At this point, the direction of the winds had changed in the Northern countries: instead of “eating more”, the message was “eat less”.
The meat and dairy producers’ lobby delayed the launch for a year. And it ensured that official guidance kept a high consumption of these foods. Large corporations, by the way, never hid that they like the pyramid.
Alice Ottoboni, a biochemist and public health researcher, was one of the first to call the attention. “The official guidelines of the USDA and its food pyramid are nutritionally and biochemically wrong. They radically changed the eating habits of tens of thousands of Americans in a massive human experiment that failed. Today, there are few questions about having a clear temporal link between ‘heart healthy’ diet and the current and growing cardiovascular disease epidemic, obesity and type 2 diabetes”.
By then, in the early 1990s, there was plenty of evidence that putting all the fats together was a mistake. And that encouraging the carbohydrates consumption, without distinction, was one of the explanations for the rising curves of obesity.
But what did the pyramid do? She determined that a lot of carbohydrate had to be consumed, that the proteins remained at an intermediate level and that fat intake should be avoided.
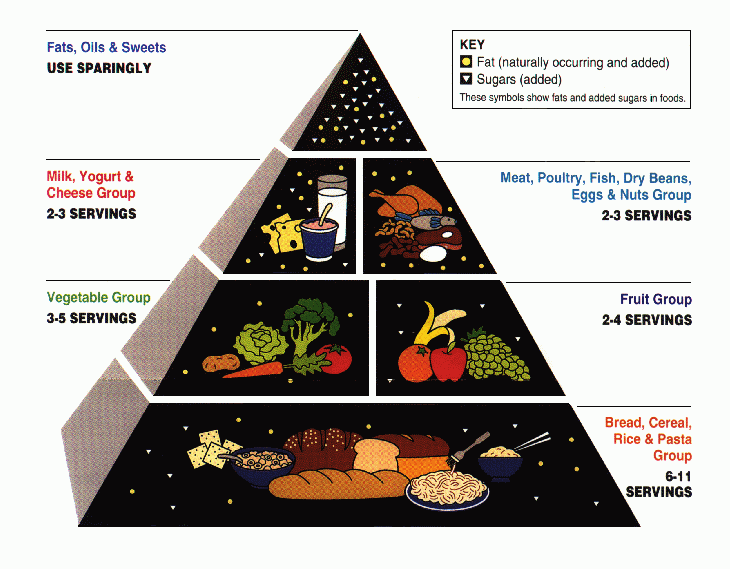
From then on the pyramid has become the most widespread and classic food representation tool. In Brazil, she arrived in 1999, in an adaptation made by professor Sonia Tucunduva Philippi, from the Public Health School of São Paulo University. Although it was not officially adopted by the government, she consisted of several public documents and was, somehow, an iconographic translation of the 2006 Food Guidelines.
“After all these years, the food pyramid image is easily recognized and presents important fixation of concepts such as food groups variety and food portions size, weight in grams and usual measures such as cup, spoon, slice”, says Sonia.
However, successive researches have shown that the pyramid is not so easy to understand.
- Chile, 2003. A survey of 898 consumers made it clear that some people thought that the food at the top was the priority, and that those at the bottom should be avoided. This interpretation has appeared in other studies.
- United States, from 2002 to 2004. Researchers were called by the USDA to assess the pyramid effectiveness. They carried out 18 focal groups, which are joint interviews aimed at a qualitative analysis. Presented to the pyramid, 80% of the participants were mistaken in at least one of the food groups – 12% in everything. People also did not understand the concept of “portion”, and overall they estimated larger quantities than the official recommendation. A classic case of “decipher me, or I will fatten you”.
- Europe, 2015. Researchers reviewed the official nutritional guidelines in the region. Of 34 countries, 22 had the pyramid as an icon, even without evaluations of effectiveness. The authors concluded that the symbol is not able to represent cultural differences. “In our view, a clearer distinction is needed between fresh and processed foods.”
That is where things get complicated. The pyramid puts very different foods in the same box. It is not necessary to be an expert to know that there is a big difference between instant noodles and potatoes.
But you may need to call in an expert to understand the difference between butter, margarine, olive oil and soybean oil. The yogurt that the pyramid recommends consuming is natural, without additives, or a version made from powder milk, with a bit of sugar? A loaf of bread is like industrialized toast, which in turn is equal to a natural fermentation bread and whole wheat flour?
It is also necessary to have a lot of patience to make complex food fit within the groups. A vegetable soup has several different nutrients. And you are not obliged to know which ones: just know that it is delicious and offers a variety of food selected over the centuries by our ancestors.
“The pyramid is not capable to approach food culture. You can consider food from a region in the pyramid but you miss the point of the cultural, social and environmental aspects of food. You ignore how the food was produced”, says Camila Maranha Paes de Carvalho, an assistant professor from the Nutrition School at the Fluminense Federal University (UFF) in Brazil and a consultant from the non-governmental organization ACT Health Promotion.
Reformulation
After that research, the USDA decided to reformulate the pyramid. The researchers had warned: the pyramid could become a useful tool only with a very strong campaign of information. Therefore, the Department of Agriculture created a website page in which you could log in, fill in your data, and receive individualized nutritional guidance. The situation only got complicated.
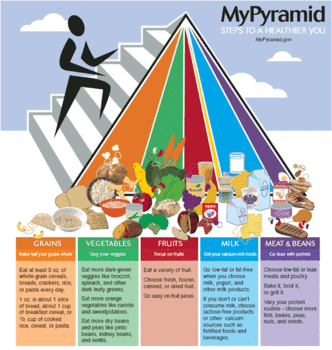

There was no lack of researchers shouting, “Stop the machines! The pyramid has already done a lot of damage”.
– Carol S. Johnston, a nutrition professor at the University of Arizona, said in 2005 that the revised pyramid still did not differentiate between saturated and unsaturated fats, and did not warn that excess carbohydrates are harmful. For her, without a change in agricultural policies, the pyramid could not deal with the obesity epidemic.
– Meir J. Stampfer and Walter C. Willett, Harvard Public Health professors, find it was an error to believe that people would distinguish fat types on their own and that the adoption of a generic formula proved to be highly troublesome. The new pyramid continued to give insufficient attention to sugar and soft drinks, and made no distinction between meats. In addition, it was “unwise” to continue recommending a high consumption of dairy products. Finally, they asked the USDA to stop providing official nutritional guidelines, which should be transferred to an entity subject to less economic pressures.
– Cardiologist Sylvan Lee Weinberg, who was from Daytona Heart Hospital in the US, argued in a 2014 article that it is time to stop recommending a high-carbohydrate diet. According to him, the pyramid may have played a negative role in the obesity and chronic diseases epidemic.
– A research group from Boston University and the Harvard School of Public Health compared the practical application of the pyramids of 1992 and 2005. The conclusion is that the revised icon worked better in terms of obtaining 16 nutrients but was still weak in terms of vitamin E and potassium, and high sodium intake.
And this is one of the paradigm issues. You can isolate N nutrients and promote research to infinity: you will always be missing or left over something. The more you move, the harder it gets. Imagine a person who decides to apply this in practice. It is not trivial.
In 2011 the United States retired the pyramid and created MyPlate. The dairy producers lobby was still there, driving people to have a cup of milk in the middle of their meals.
New Focus
Brazil published the updated Dietary Guidelines for the Brazilian Population at the end of 2014. The key message of the Health Ministry document, which has become global reference, is to have the diet base with “in natura” food and minimally processed, and avoid ultra-processed.
This assumption reflects the position of the Epidemiological Research in Nutrition and Health Nucleus of USP (Nupens), responsible for the initial text preparation, and then submitted to a public inquiry. Nupens and his coordinator, Carlos Monteiro, gained worldwide highlight when proposing the food classification by extension and purpose of processing, and no longer by nutritional profile. This means valuing food as in the past, and leaving aside the separate nutrients approach.
Already in the public inquiry phase, questions arose: where were the portions used by nutritionists in consulting rooms and hospitals? We found 71 times the word “pyramid” among the suggestions presented. Some specifically stated the work of Sonia Tucunduva, the USP professor who brought this icon from Brazil. Several sides of this story were mobilized in a battle that went beyond scientific concern.
But those responsible for the new Guide preparation understood that it would not make sense to incorporate the pyramid, which carries exactly the logic that is tried to be disrupted. “You do not care to group the food according to its culinary use, when you put a cereal at the base of the pyramid, the rice, and at the same time you put a bread, you put an ultra-processed, you put a biscuit”, criticizes Patricia Jaime, professor at the Public Health School at São Paulo University. “Also there is no worry about what is the meal composition culture, even more about from where the food comes from.”
She was in charge of the General Coordination of Food and Nutrition of the Health Ministry when the new document was prepared. They thought of having a graphic representation that would summarize the new official orientation, but how to create a symbol that did not mess up the cultural, social and environmental dimension that the Guide advocates?
“Those who need to work with servings in specific situations can rethink the graphical materials used in communication with the population. However, people need to understand about what we are talking, they need to have coverage and autonomy over food”, says Camila Maranha, professor at the Fluminense Federal University.
She is the doctoral thesis author “Building the Food Guide Process for the Brazilian Population of 2014: consensus and conflicts”, published in 2017. The paper states precisely the movement of the different interest groups surrounding the path definition of the official food guidance. “It is the nutritionist’s role to clarify many of the issues involving eating in addition to defining nutrients. It is to understand that person as someone who can be empowered to change reality”, she adds.
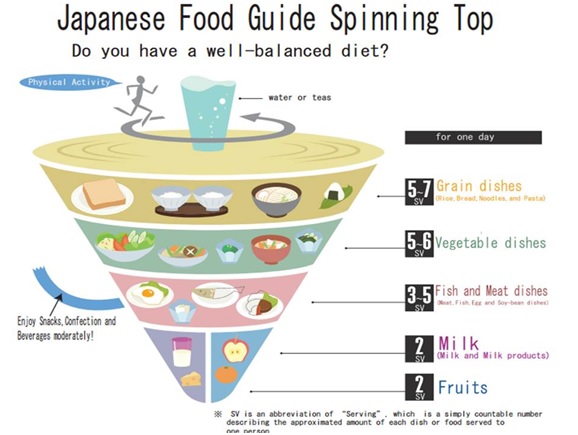
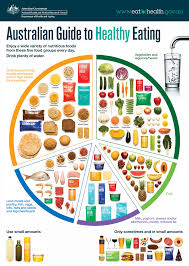
In some countries, the pyramid is no longer used, but not the logic of separating food by macro and micronutrients.
This is the Venezuela‘s symbol.
The one from Japan.
And this one from Australia.
Ubiquitous
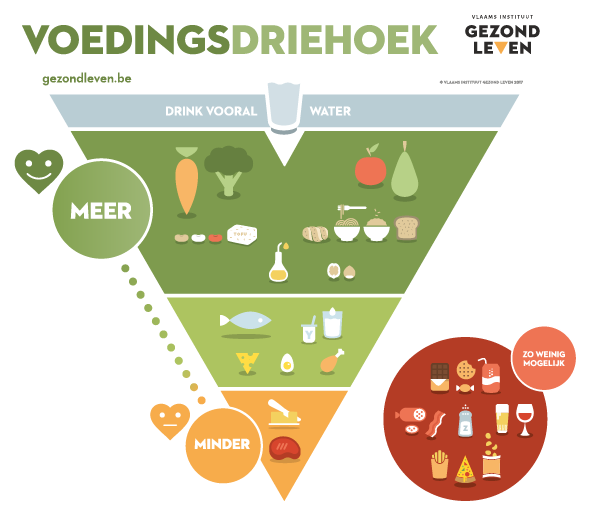
Other countries have tried to redesign the pyramid. In Belgium’s case, which has in a sense put the ultra-processed in the position of what should be avoided, and inverted the icon, upside down, so that the food that must be prioritized is on top.
The fact is that the pyramid is still there. Nevertheless, no one knows for sure how present she is. Therefore, we decided to circulate a questionnaire among nutrition students in Brazil. We had 346 responses that show that this icon continues to enter the classroom. 93.9% said they saw the pyramid during graduation. Of these, 20.8% reported that it was discussed only once, 47.1% up to five times a year, and 26.9% very often.
Most, 56.1%, understand that the pyramid was recommended by the academic staff as a nutritional guidance tool. Moreover, most interesting, 47.1% consider that she and the Guide follow complementary rationale.
Future research may tell us more about resistance to the 2014 Guide inside college. Do egos have anything to do with this? No question, but we do not know how much.
Does the classification based on the processing extension bring anger to the industry and to researchers near it? Very much.
Does the lack of an icon that can summarize the information in the Guide make it harder to be shared? It is possible. Marina Vilar Geraldi, at the time a student of the Medicine, made a graphical representation in disks. The largest, green, for “in natura” and minimally processed foods. In blue, the processed, which should have limited consumption. In orange, the ultra-processed, which should be avoided.
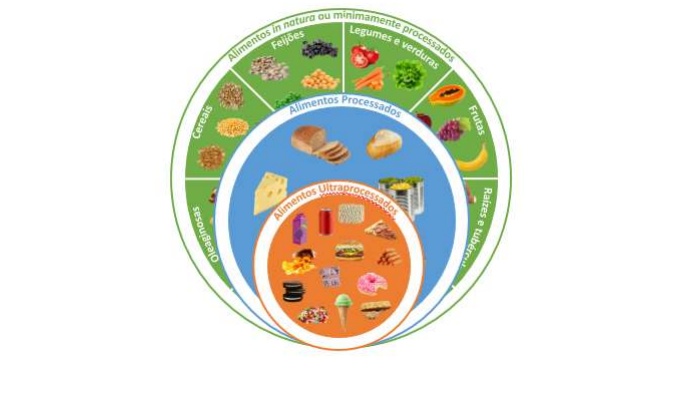
Marina’s suggestion is that the material should be used in nutritional guidance, “in a way that promotes patient autonomy, to enable healthy food choices and practices, resulting in better interaction and results during nutritional monitoring”.
It is only necessary to convince the pyramid that it is time to rest.

